
Marketing teams today are awash in data, yet many still struggle to answer a deceptively simple question: which marketing activities actually move the business forward? That is the question marketing analytics exists to answer. It is the discipline of turning campaign, channel, and customer data into clear decisions, not just colorful dashboards. As acquisition costs climb and leadership demands proof of return on investment, the ability to measure, interpret, and act on marketing data has shifted from a nice-to-have to a core competency.
In this guide, you will learn what marketing analytics actually means, the metrics that matter most across the funnel, how analytics work in practice, the measurable benefits documented by leading business institutions, and the common challenges teams face when adopting an analytical approach. The goal is to give you a practical, source-anchored explainer you can use whether you are a marketer trying to build credibility with executives or a business owner trying to make sense of your reports.
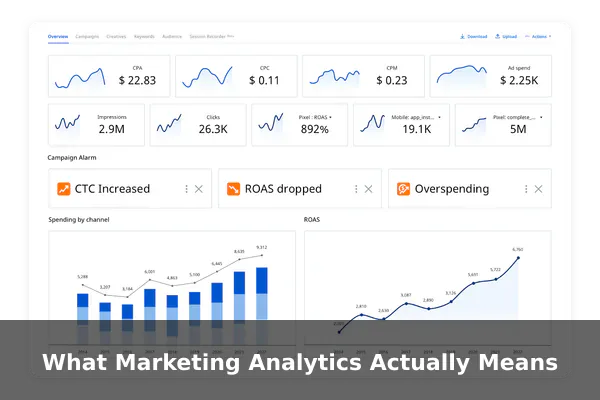
What Marketing Analytics Actually Means
According to definitions aligned with the American Marketing Association, marketing analytics is the practice of measuring, managing, and analyzing marketing performance to maximize effectiveness and optimize return on investment. In plainer language, it is the process of collecting data from marketing activities, transforming it into insight, and using those insights to make better decisions about where to spend time, money, and creative effort.
It is helpful to distinguish marketing analytics from two adjacent disciplines it is often confused with:
- Web analytics focuses narrowly on website behavior, such as page views, sessions, and on-site conversions.
- Business intelligence aggregates data across the entire organization, including finance, operations, and HR.
- Marketing analytics sits in between, focusing on the full customer journey across paid, owned, and earned channels, and connecting marketing actions to revenue outcomes.
The Three Common Scopes of Marketing Analytics
Most practitioners group analytics work into three progressively more advanced scopes:
- Descriptive analytics answers “what happened?” using historical data such as last quarter’s traffic, conversion rates, or campaign spend.
- Predictive analytics answers “what is likely to happen?” using statistical models to forecast outcomes such as customer churn or lead-to-customer conversion.
- Prescriptive analytics answers “what should we do?” by recommending specific actions, such as reallocating budget toward the channel most likely to deliver incremental revenue.
Most teams begin with descriptive analytics and mature toward predictive and prescriptive work as their data quality, tooling, and skills grow.
Core Marketing Analytics Metrics You Should Track
One of the fastest ways to lose focus is to track every metric available. A more sustainable approach is to group metrics into three buckets that mirror the customer journey: acquisition, engagement, and value. The exact list will vary by business model, but the categories below cover the metrics most commonly referenced in industry guidance from sources like Google Analytics Help and Harvard Business Review.
Acquisition Metrics
Acquisition metrics measure how efficiently you bring new prospects into your funnel.
- Customer Acquisition Cost (CAC): Total marketing and sales spend divided by the number of new customers acquired in the same period. A rising CAC without a matching rise in customer value is an early warning signal.
- Click-Through Rate (CTR): The percentage of people who click an ad, link, or email after seeing it. CTR helps evaluate creative and targeting quality.
- Cost Per Click (CPC): The average cost paid for each click on a paid ad. CPC reflects competitive pressure and the relevance of your ads.
- Impressions and Reach: The number of times your content is shown and the number of unique people who saw it. These help size the top of the funnel.
Engagement Metrics
Engagement metrics measure how prospects interact with your content and properties. Standard definitions are well documented in Google Analytics Help.
- Sessions and Users: Counts of visits and unique visitors over a period.
- Bounce Rate or Engagement Rate: The percentage of single-page visits (or, in newer analytics models, the share of sessions meeting an engagement threshold).
- Average Session Duration and Pages per Session: Indicators of content depth and relevance.
- Conversion Rate: The percentage of sessions or users who complete a defined goal, such as form fills, downloads, or purchases.
Value Metrics
Value metrics connect marketing activity to revenue and profitability, which is where executive attention typically concentrates.
- Customer Lifetime Value (CLV or LTV): The total revenue (or gross profit) a typical customer is expected to generate during their relationship with the business.
- Return on Ad Spend (ROAS): Revenue generated for every unit of currency spent on advertising.
- Marketing-Attributed Revenue: The share of revenue that can reasonably be tied back to marketing-influenced touchpoints.
- Payback Period: The number of months it takes for a new customer’s gross profit to cover the cost of acquiring them.
A practical rule of thumb in much of the published guidance is that CLV should comfortably exceed CAC for a sustainable business, with the exact ratio depending on margins, retention, and growth stage.
How Marketing Analytics Works in Practice
Behind every useful chart is a pipeline that moves data from the places it is created to the places it is consumed. While tools and stack choices vary, the workflow typically follows five stages.
1. Data Collection
Data enters the system from a mix of owned and third-party sources: website tags, mobile SDKs, advertising platforms, CRM systems, email tools, and offline events such as in-store purchases or sales calls. Modern privacy expectations make consent management a foundational part of this step rather than an afterthought.
2. Data Integration
Raw data from disparate tools needs to be cleaned, standardized, and joined together. This is often done through a customer data platform, a data warehouse, or built-in integrations between marketing tools. Without this step, teams end up comparing apples to oranges and arguing about whose number is correct.
3. Attribution and Measurement
Attribution assigns credit for conversions across the touchpoints a customer interacts with. Common models include:
- First-touch and last-touch, which credit a single interaction.
- Linear and time-decay, which spread credit across the journey.
- Data-driven attribution, which uses modeled probabilities to estimate the incremental contribution of each touchpoint.
No model is perfect. Industry guidance from outlets like Harvard Business Review consistently emphasizes pairing attribution with controlled experiments, such as geo-based holdouts and incrementality tests, to validate findings.
4. Reporting and Visualization
This is the layer most non-analysts see: dashboards, executive scorecards, and self-serve reports. The most effective reports answer specific questions for specific audiences rather than trying to display everything at once.
5. Decisions and Iteration
Analytics only pays off when it changes behavior. Healthy teams build a rhythm of weekly or monthly reviews where insights are translated into concrete actions, such as pausing an underperforming campaign, doubling down on a high-ROAS channel, or testing a new audience segment.

Key Benefits for Businesses and Marketers
Research and commentary from sources such as Harvard Business Review, MIT Sloan Management Review, and McKinsey & Company have repeatedly highlighted a consistent set of benefits when organizations adopt mature marketing analytics practices. These benefits can vary in size depending on industry, data quality, and execution, so they are best treated as directional rather than guaranteed.
Better Return on Marketing Investment
By measuring what actually drives revenue, teams can shift spending from low-performing tactics to higher-performing ones. Over time, this typically improves blended ROAS and reduces wasted spend on activities that look busy but do not move the needle.
Sharper Targeting and Personalization
Analytics surfaces patterns in which segments respond best to which messages, channels, and offers. That insight feeds more relevant creative, smarter audience targeting, and better personalization, which can lift conversion rates while reducing audience fatigue.
Faster Optimization Cycles
When measurement is reliable, teams can run more experiments with more confidence. This compresses the time it takes to learn what works, an advantage frequently highlighted in MIT Sloan’s coverage of data-driven organizations.
Deeper Customer Insight
Beyond campaign metrics, analytics helps teams understand why customers buy, churn, or upgrade. These insights inform product positioning, pricing, and retention strategies, not just marketing tactics.
Stronger Alignment With Revenue Teams
When marketing reports share definitions and data with sales and finance, conversations shift from “whose number is right?” to “what should we do next?” McKinsey’s marketing and sales coverage repeatedly notes that this alignment is one of the strongest correlates of growth in analytics-driven organizations.
Common Challenges and How to Address Them
Despite the upside, marketing analytics initiatives often stall. Being honest about the obstacles helps teams plan realistically.
Data Quality and Consistency
Tracking gaps, duplicate records, and inconsistent naming conventions are common culprits behind unreliable reports. Investing early in a tagging standard, a documented data dictionary, and routine quality checks pays off well beyond its initial cost.
Privacy and Consent Constraints
Evolving privacy regulations, browser changes, and platform restrictions have reshaped how marketing data can be collected and used. Teams should work closely with legal and privacy stakeholders, adopt consent-aware tracking, and avoid relying on a single identifier or signal.
Attribution Complexity
No attribution model perfectly captures the truth, especially across long, multi-channel journeys. Pairing attribution with incrementality testing and clear assumptions, rather than treating any single number as gospel, is a more defensible posture.
Skills and Organizational Gaps
Many teams have more tools than they have people trained to use them well. Closing this gap may involve hiring analytics specialists, investing in upskilling existing marketers, or partnering with external experts for specific projects.
Getting Started With Marketing Analytics
If your team is early in its analytics journey, resist the urge to start with a complex stack. A focused, disciplined start usually outperforms an ambitious but unfocused one.
- Define your goals. Tie analytics work to a small number of business objectives, such as reducing CAC, growing CLV, or improving ROAS in a specific channel.
- Choose three to five KPIs. Pick metrics that directly reflect those goals, mixing acquisition, engagement, and value indicators. Resist adding more until the first set is reliable and reviewed regularly.
- Instrument tracking properly. Audit your tags, events, and conversions. Document definitions so everyone agrees on what each metric means.
- Set a review cadence. Weekly tactical reviews and monthly strategic reviews are a common starting structure. Use them to translate insights into concrete next actions.
- Iterate and expand. As confidence grows, layer in attribution modeling, experimentation, and predictive use cases. Mature capabilities are built one reliable layer at a time.
Tools Worth Knowing About
Without endorsing specific vendors, it is worth knowing that most analytics stacks include some combination of a web and app analytics platform, an advertising platform’s native reporting, a CRM or marketing automation tool, a data warehouse, and a visualization layer. The right choices depend on your scale, budget, and in-house skills.
Conclusion
Marketing analytics is not about producing more reports. It is about asking sharper questions, measuring what truly matters, and making faster, better-informed decisions. By grounding your work in clear definitions, a manageable set of acquisition, engagement, and value metrics, and a healthy respect for the limits of any single data point, you set your team up to capture the kind of measurable benefits that institutions like the American Marketing Association, Harvard Business Review, MIT Sloan, and McKinsey have documented for years.
Start small, stay honest about what you can and cannot measure, and build a rhythm of turning insight into action. Over time, that discipline compounds: better data informs better strategies, which deliver better results, which earn the trust and budget needed to keep maturing your analytics capability. That is how marketing analytics moves from a buzzword to a durable business advantage.
Official references
- American Marketing Association (ama.org) – Leading professional marketing association providing authoritative definitions of marketing and marketing analytics concepts.
- Harvard Business Review (hbr.org) – Peer-reviewed business publication with authoritative articles on marketing analytics frameworks and ROI measurement.
- Google Analytics Help (support.google.com) – Official product documentation defining standard web and marketing analytics metrics used industry-wide.
- MIT Sloan Management Review (sloanreview.mit.edu) – Academic source covering data-driven marketing research and business metrics from MIT Sloan School of Management.
- McKinsey & Company – Marketing & Sales Insights (mckinsey.com) – Primary research and authoritative reports on marketing analytics adoption, benefits, and business impact.