
Return on ad spend, usually shortened to ROAS, is one of the fastest ways to judge whether advertising is producing revenue or simply burning budget. Marketers, business owners, and media buyers use it because it turns a messy question into a simple one: how many dollars came back for every dollar spent on ads?
That simple question often leads to confusing answers. Some teams include only platform spend, while others add agency fees, design costs, commissions, and software. Some report ROAS as a ratio, others as a percentage, and many compare campaigns with completely different margins or objectives. A ROAS number is only useful when the formula, inputs, and context are clear.
This guide explains the ROAS meaning in plain language, walks through the standard ROAS formula, shows what should count in ad spend, and gives practical examples you can use right away. By the end, you will know how to calculate return on ad spend correctly, how to interpret a good ROAS, and how to improve it without making common reporting mistakes.
ROAS Meaning in Simple Terms
Return on ad spend measures the revenue generated from advertising compared with the amount spent on that advertising. In plain English, it answers this question: for every $1 spent on ads, how much revenue did the campaign bring in?
What ROAS Actually Measures
ROAS is an efficiency metric for paid media. It tells you whether ad spend is producing enough top-line revenue to justify more budget, less budget, or a strategic change. You can measure ROAS at many levels, including a single ad, a keyword group, a campaign, a channel, or your entire paid media program.
For example, if a Google Ads campaign generated $8,000 in attributed revenue from $2,000 in ad spend, the ROAS is 4. That means the campaign returned $4 in revenue for every $1 spent.
What ROAS Does Not Measure
ROAS does not automatically tell you whether a campaign was profitable. Revenue is not the same as profit. If your product margins are thin, shipping is expensive, or discounts are aggressive, a campaign can show a respectable ROAS and still lose money. That is why smart marketers use ROAS as a decision tool, not as a standalone truth.
It also does not tell you everything about customer quality. A campaign may show lower short-term ROAS but attract new customers with high future value. Another campaign may show extremely high ROAS because it mainly converts people who already planned to buy. The number matters, but the meaning depends on the business model and the goal.
Why Marketers Use ROAS So Often
Despite its limits, ROAS remains popular because it is practical. It gives fast feedback, works across most advertising platforms, and helps compare performance between campaigns. When budget decisions need to happen daily or weekly, ROAS is often more useful than waiting for a full profitability report that arrives too late to guide execution.
- It helps allocate budget between campaigns and channels.
- It gives a clear benchmark for paid media efficiency.
- It is easy to explain to stakeholders who want a simple performance signal.
- It can reveal which audiences, creatives, or offers deserve more testing.
The ROAS Formula and How to Calculate It
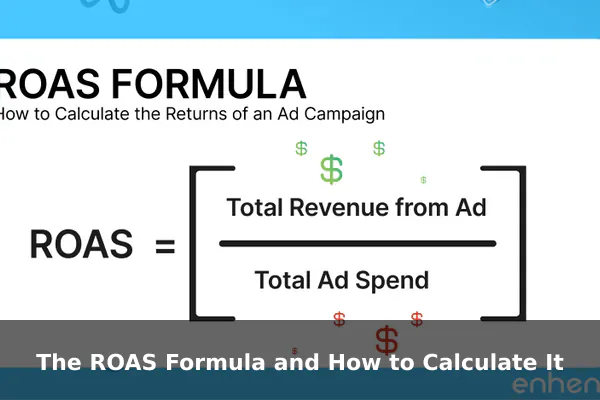
The standard ROAS formula is simple, but the inputs must be defined carefully.
ROAS = Revenue Attributed to Ads / Ad Spend
If a campaign generated $10,000 in revenue and cost $2,500 to run, the calculation is:
$10,000 / $2,500 = 4
This means the campaign delivered a 4:1 ROAS, or $4 in revenue for every $1 spent.
How to Read the Result
ROAS is usually expressed as a ratio or multiple rather than as a percentage. A result of 3 means 3:1, or $3 returned for each $1 spent. Some teams multiply the number by 100 and describe 4 ROAS as 400 percent, but that can create confusion with ROI. For day-to-day reporting, the ratio format is usually clearer.
- 1.0 ROAS means $1 in revenue for every $1 in ad spend.
- 2.0 ROAS means $2 in revenue for every $1 in ad spend.
- 5.0 ROAS means $5 in revenue for every $1 in ad spend.
A Simple Step-by-Step Calculation Process
- Choose the time period you want to measure, such as a week, month, or campaign flight.
- Determine the revenue attributed to the ads during that period.
- Total the ad spend for the same period.
- Divide attributed revenue by ad spend.
- Label the result clearly so other people know whether it is media-only ROAS or a fuller cost view.
This last step matters more than many teams realize. If one report uses only platform spend and another includes creative and agency fees, the ROAS numbers are not directly comparable.
The Most Common Calculation Problem
The formula is easy. Attribution is hard. If your tracking setup overstates paid conversions, ROAS will look artificially strong. If offline sales are missing, ROAS may look weaker than reality. Before relying on ROAS, make sure the underlying conversion tracking is reasonably trustworthy.
It also helps to decide whether you are using gross revenue, net revenue, or contribution revenue. Gross revenue is common because it is easy to pull from ad platforms and analytics tools. Net or contribution revenue can be more useful for internal decision-making, especially when returns, refunds, or discounts materially affect the economics.
What Counts in Ad Spend
One of the biggest reasons ROAS reports conflict is that different teams include different costs in the denominator. There is no single universal rule. The right approach depends on why you are calculating ROAS and who will use the result.
Costs Commonly Included
At a minimum, most marketers include the direct amount paid to distribute the ads. That usually means:
- Media spend on platforms such as Google Ads, Meta Ads, LinkedIn Ads, TikTok Ads, or display networks
- Cost per click, cost per thousand impressions, or cost per acquisition charges billed by the platform
- Marketplace or network placement fees directly tied to campaign delivery
This version is often called media-only ROAS. It is useful for campaign optimization because it isolates the part of the budget a media buyer can adjust quickly.
Costs Often Included for a More Realistic View
If the goal is broader business decision-making, many companies expand ad spend to include related execution costs. These may include:
- Agency management fees
- Freelancer or contractor costs for campaign setup
- Creative production costs for video, design, or copy
- Landing page tools or testing software used specifically for the campaign
- Affiliate or partner commissions tied to the advertising effort
This version is sometimes called fully loaded ROAS or blended ROAS. It usually produces a lower number than media-only ROAS, but it gives decision-makers a more honest view of the real cost to generate revenue.
Costs Usually Excluded
Some expenses are real business costs but are not always included in a standard ROAS calculation. Examples include fixed salaries, office rent, general software subscriptions, finance costs, and broad overhead. Those items are important for profit analysis, but including every overhead item in ROAS can make the metric too slow and messy for practical campaign management.
A useful compromise is to report two versions:
- Platform ROAS for daily optimization and channel management
- Fully loaded ROAS for management reviews and budget planning
Both are valid as long as the labels are clear and consistent over time.
Why Consistency Matters More Than Perfection
The biggest mistake is not choosing the wrong denominator. The biggest mistake is changing the denominator without telling anyone. A campaign that looked excellent under media-only ROAS may look average under fully loaded ROAS. Neither number is automatically wrong, but they answer different questions. If you want to compare campaigns accurately, use the same cost logic across them.
ROAS Calculation Examples
Examples make the ROAS formula easier to understand because the number only becomes meaningful when you connect it to actual business conditions.
Example 1: Strong Ecommerce ROAS
An online store spends $2,000 on paid search for a product category with healthy margins. The campaign produces $12,000 in attributed sales.
ROAS = $12,000 / $2,000 = 6
This is a 6:1 ROAS, meaning the store earns $6 in revenue for every $1 spent on ads. On the surface, that is strong. If the gross margin on those products is 60 percent, then the store generated $7,200 in gross profit before ad spend. After subtracting the $2,000 ad cost, $5,200 remains to cover other operating expenses and profit. In this case, the campaign is not just efficient on paper; it is likely economically attractive.
Example 2: Decent-Looking ROAS That Still Loses Money
A different campaign spends $3,000 and produces $9,000 in sales.
ROAS = $9,000 / $3,000 = 3
A 3:1 ROAS may sound acceptable, but now assume the products carry only a 25 percent gross margin because of discounts, shipping subsidies, or reseller pricing. That means the $9,000 in revenue creates only $2,250 in gross profit before advertising. After subtracting $3,000 in ad spend, the campaign is underwater.
This is one of the most important lessons in ROAS analysis: a good-looking ratio can still be a bad business result if margins are too thin.
Example 3: Lead Generation ROAS
A B2B company spends $5,000 on LinkedIn ads to generate leads for a service with a longer sales cycle. The campaign brings in 200 leads. After sales follow-up, 20 of those leads become customers, and each customer generates $800 in first-year revenue.
Total revenue = 20 x $800 = $16,000
ROAS = $16,000 / $5,000 = 3.2
This campaign has a 3.2 ROAS. That may be strong or weak depending on the company’s margins and close rate assumptions. Lead generation campaigns often require more patience because revenue arrives later than the ad click. If attribution windows are too short, the initial ROAS can look unfairly low.
Example 4: The Difference Between Media-Only and Fully Loaded ROAS
Suppose a brand spent $4,000 on social ads and generated $20,000 in sales. Media-only ROAS is easy:
$20,000 / $4,000 = 5
Now add $1,000 in creative production and a $500 agency fee directly related to the campaign. Total campaign cost becomes $5,500.
Fully loaded ROAS = $20,000 / $5,500 = 3.64
That is a major difference. The campaign still looks promising, but the decision changes from outstanding to solid. This is why reporting definitions matter so much.
How to Interpret a Good ROAS
There is no universal answer to the question, what is a good ROAS? A number that looks excellent for one business may be unacceptable for another. The right threshold depends on margins, operating structure, customer behavior, and campaign objectives.
Margins Set the Floor
If you want a practical starting point, calculate your break-even ROAS. A simple version is:
Break-even ROAS = 1 / contribution margin
If your contribution margin after variable costs is 50 percent, your break-even ROAS is 2.0. If your contribution margin is 25 percent, your break-even ROAS is 4.0. That means a business with thin margins usually needs a much higher ROAS just to avoid losing money on the sale.
This is why broad benchmark articles can mislead readers. Saying that 4:1 is always good ignores the economics behind the number. The better question is not whether the ROAS looks high. The better question is whether the ROAS clears the margin requirement for that offer.
Campaign Objective Changes the Benchmark
Different campaign goals justify different ROAS expectations.
- Retargeting campaigns often show higher ROAS because they target people already close to purchase.
- Branded search campaigns can also look very strong because they capture existing demand.
- Prospecting campaigns aimed at new audiences usually show lower ROAS at first because they create demand rather than simply harvest it.
- Lead generation campaigns may need longer measurement windows before the revenue becomes visible.
That means a lower ROAS is not automatically bad if the campaign is serving a top-of-funnel or new customer acquisition role.
Scale Matters Too
A tiny campaign can produce an impressive ROAS and still contribute very little revenue overall. Another campaign may show a lower ROAS but drive far more total profit because it works at larger scale. Decision-makers should look at both efficiency and volume.
For example, a campaign producing 8:1 ROAS on $200 of spend is interesting, but it should not automatically receive all the budget. A second campaign producing 4:1 ROAS on $20,000 of spend may be creating much more value for the business.
Use ROAS as a Range, Not a Single Magic Number
Strong operators rarely manage to one fixed ROAS target across every audience and channel. Instead, they set acceptable ranges based on intent, seasonality, product margin, and customer type. That approach is more realistic than demanding the same threshold from prospecting, retargeting, branded search, and paid social at the same time.
ROAS vs ROI: What Is the Difference?
ROAS and ROI are related, but they are not interchangeable. Confusing them leads to poor reporting and weak decisions.
ROAS Focuses on Advertising Efficiency
ROAS compares revenue to ad spend. It is designed for evaluating marketing performance, especially paid media. It answers a tactical question: is this ad investment generating enough revenue to justify more spending?
ROI Focuses on Overall Return
Return on investment, or ROI, usually measures profit relative to total investment. It includes more costs and gives a broader financial view. ROI is better for asking whether the overall initiative made money, not just whether the ad delivery itself looked efficient.
Consider this example:
- Revenue from ads: $4,000
- Ad spend: $1,000
- Cost of goods sold: $2,000
- Additional campaign costs: $700
ROAS = $4,000 / $1,000 = 4
That looks healthy. But profit after these costs is only $300. The campaign may still be worth running for strategic reasons, yet the business result is much less impressive than the ROAS alone suggests.
When to Use Each Metric
- Use ROAS for channel optimization, bid decisions, creative testing, and budget allocation.
- Use ROI for broader profitability analysis and executive decision-making.
In other words, ROAS helps you manage advertising. ROI helps you judge the financial outcome of the investment as a whole.
Common ROAS Mistakes to Avoid
ROAS is simple enough to calculate and easy enough to misuse. Many reporting problems come from avoidable mistakes rather than from the formula itself.
Reporting Mistakes
- Counting all revenue as ad-driven revenue. Paid campaigns often assist conversions, but they do not always deserve full credit.
- Ignoring refunds, cancellations, or returns. Gross sales can make ROAS look stronger than actual realized revenue.
- Mixing cost definitions. Comparing media-only ROAS in one campaign with fully loaded ROAS in another is misleading.
- Using different attribution windows. A 7-day click view is not directly comparable to a 30-day click view.
Decision-Making Mistakes
- Chasing high ROAS at the expense of growth. The highest-ROAS campaigns often target warm audiences and can become saturated.
- Judging results too quickly. Small sample sizes can create unstable ROAS numbers.
- Ignoring margin differences between products. A lower-ROAS campaign on high-margin products may be better than a higher-ROAS campaign on low-margin products.
- Failing to separate new and returning customers. A campaign that mainly brings back existing buyers may inflate short-term ROAS while doing little for long-term growth.
These mistakes matter because ROAS often drives budget decisions. If the measurement is weak, the budget moves in the wrong direction.
How to Improve ROAS
Improving ROAS does not always mean cutting spend. In many cases, the better move is to increase conversion efficiency, raise average order value, or improve measurement so spending decisions become smarter.
Improve the Traffic Before the Click
- Tighten audience targeting to reduce wasted impressions and clicks.
- Use stronger keyword intent and add negative keywords where appropriate.
- Exclude weak placements, low-quality traffic sources, or irrelevant geographies.
- Match the creative message to the audience stage and offer.
Better traffic usually improves ROAS because fewer ad dollars are spent attracting people who were never likely to convert.
Improve the Experience After the Click
- Send traffic to landing pages that match the ad promise exactly.
- Reduce page load time, especially on mobile devices.
- Make the call to action clearer and reduce unnecessary form fields.
- Strengthen trust signals such as testimonials, reviews, guarantees, or transparent pricing.
Many businesses blame low ROAS on the ad platform when the bigger problem is a weak landing page or checkout flow. If conversion rate improves, ROAS often improves even with the same traffic cost.
Increase Revenue Per Conversion
ROAS can rise not only because costs fall, but also because revenue per customer increases. Useful tactics include:
- Upsells and cross-sells
- Bundled offers
- Threshold-based free shipping
- Higher-value packages for qualified buyers
- Offers designed to lift average order value without crushing margin
If the same campaign produces higher order values, the ROAS formula improves immediately.
Improve the Measurement System
- Check pixel and event tracking regularly.
- Use clean naming conventions and UTM structures.
- Import offline conversions where possible for lead generation.
- Review results by cohort, not only by same-day platform reports.
Clean measurement does not directly raise ROAS, but it prevents waste and helps you scale the right campaigns with more confidence.
Manage to Marginal ROAS, Not Just Average ROAS
Average ROAS tells you how the campaign has performed overall. Marginal ROAS helps you judge what happens when you add the next dollar of spend. This distinction matters when campaigns are scaling. A campaign with a 5:1 average ROAS may still produce weak incremental returns at a higher budget level. Looking at marginal performance helps avoid overspending just because the average number still looks good.
In practice, that means reviewing performance by spend tier, audience saturation, and creative freshness rather than assuming a historically strong ROAS will continue forever.
Conclusion
Return on ad spend is a powerful marketing metric because it makes advertising efficiency easier to see, compare, and act on. The core formula is simple, but useful ROAS analysis depends on consistent cost definitions, credible attribution, and realistic interpretation based on margin and objective.
If you remember only a few things, remember these: calculate ROAS with a clear numerator and denominator, distinguish media-only ROAS from fully loaded ROAS, never confuse revenue efficiency with profit, and judge performance against your own economics instead of a generic benchmark. Used that way, ROAS becomes more than a dashboard number. It becomes a practical tool for smarter budget allocation, better campaign optimization, and stronger marketing decisions.