
Few numbers reveal the health of a subscription, service, or SaaS business as quickly as churn rate. It is the percentage of customers — or recurring revenue — that a company loses in a given period, and it sits at the center of nearly every conversation about retention, customer lifetime value, and sustainable growth. While acquisition often dominates marketing dashboards, churn quietly determines whether all those hard-won customers actually compound into a durable business.
This guide explains what churn rate means, how to calculate it correctly, how customer churn differs from revenue churn, and why even small percentage shifts can move profitability by an outsized amount. The definitions, formulas, and economic logic below follow conventions used by widely cited sources such as Investopedia, the Corporate Finance Institute (CFI), Harvard Business Review, McKinsey & Company, and Bain & Company.
What Churn Rate Means in Business
In plain terms, churn rate measures the share of customers who stop doing business with a company during a defined period. If a SaaS platform begins the quarter with 1,000 paying customers and loses 50 of them by the end, its customer churn rate for that quarter is 5%. Investopedia describes it as the rate at which customers discontinue a service, and CFI frames it as a core retention metric that directly mirrors how well a company keeps the customers it already has.
Conceptually, churn is the inverse of retention. If retention rate tells you the percentage of customers who stayed, churn rate tells you the percentage who left. The two always add up to 100% within the same cohort and time window, which is why product, marketing, and finance teams often track them side by side.
Why It Is Treated as a Leading Indicator
Churn is considered a leading indicator of long-term health because it shows up earlier than revenue declines. A business can post strong top-line growth while quietly losing existing customers, masking weak unit economics. By isolating departures from new acquisition, churn rate exposes whether growth is being built on a stable base or on a leaky bucket.
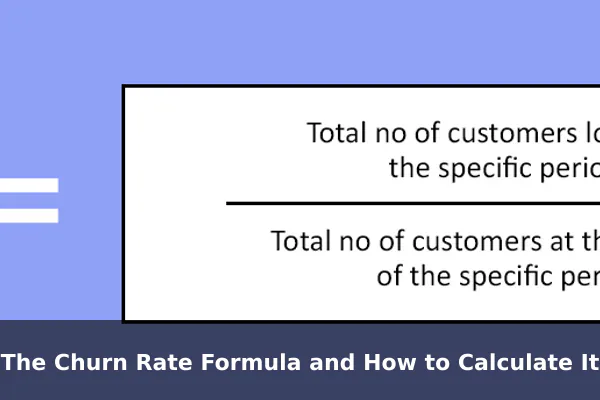
The Churn Rate Formula and How to Calculate It
The standard customer churn rate formula is straightforward:
Churn Rate (%) = (Customers Lost During Period ÷ Customers at Start of Period) × 100
Consider a worked example. A streaming service starts January with 20,000 subscribers. During the month, it loses 600 subscribers. Even if it also gains new subscribers during that period, the monthly customer churn rate is calculated only against the starting base:
- Customers at start of period: 20,000
- Customers lost during period: 600
- Churn rate: (600 ÷ 20,000) × 100 = 3% per month
Choosing the Right Time Window
Period selection has a significant effect on the number. Monthly churn rates look small but compound quickly when annualized. A 3% monthly churn does not equal 36% annual churn because the base shrinks each month; the compounded figure is closer to about 30.6%. For longer sales cycles or annual contracts, quarterly or annual churn rates are usually more meaningful.
Common Calculation Pitfalls
- Mixing new and existing customers: The denominator should be customers at the start of the period, not the average or end-of-period count.
- Ignoring cohorts: Aggregated churn can hide the fact that recent cohorts behave very differently from mature ones.
- Counting voluntary and involuntary churn together: Payment failures (involuntary churn) require different fixes than cancellations.
Customer Churn vs. Revenue Churn (Gross and Net)
Counting customers who leave is only one lens. For subscription businesses, it often matters more to measure how much recurring revenue walks out the door, because not all customers contribute equally. CFI and Investopedia both highlight the distinction between customer churn and revenue churn.
Customer (Logo) Churn
This is the headline number described above: the percentage of customer accounts lost. It treats every customer as equal, which is useful for product and onboarding diagnostics but can be misleading when revenue is concentrated in a few large accounts.
Gross Revenue Churn
Gross revenue churn (also called gross MRR churn) measures lost recurring revenue from cancellations and downgrades, divided by recurring revenue at the start of the period. It ignores expansion revenue and shows the raw rate at which existing revenue erodes.
Net Revenue Churn
Net revenue churn subtracts expansion revenue — upsells, cross-sells, and seat additions from existing customers — from the lost revenue before dividing by starting revenue. When expansion outpaces losses, net revenue churn can be negative, a state often described as net revenue retention above 100%. Many high-performing SaaS businesses are evaluated heavily on this metric.
Choosing the right lens depends on the question being asked. To diagnose product fit, customer churn is informative. To evaluate revenue durability and SaaS quality of growth, net revenue churn is generally the sharper tool.
Why Churn Rate Matters: The Economics of Retention
The reason executives obsess over churn is mathematical. Customer lifetime value (LTV) is roughly inversely proportional to churn rate. If average monthly churn is 5%, the implied average customer lifetime is about 20 months; cut churn to 2.5%, and the implied lifetime doubles, even before considering any change in average revenue per user.
Bain & Company’s long-running research, popularized by Fred Reichheld, has emphasized that modest improvements in customer retention can produce disproportionately large gains in profitability, because retained customers tend to cost less to serve and often spend more over time. Harvard Business Review and McKinsey & Company have published extensively on similar themes, arguing that retention economics are frequently underweighted relative to acquisition spend. Exact figures vary by industry and study, so the principle, not a single statistic, is what matters: small reductions in churn compound into meaningfully larger lifetime value and stronger unit economics.
Common Causes of High Churn
Reducing churn starts with diagnosing why customers leave. While every business is different, most root causes fall into a handful of recognizable categories:
- Weak onboarding: Customers who never reach the product’s core value moment churn at much higher rates.
- Product–market fit gaps: The product solves a problem, but not painfully enough or not for the right audience.
- Pricing and packaging friction: Plans that feel misaligned with the value delivered drive cancellations at renewal.
- Service failures: Outages, slow support, or unresolved issues accelerate departures.
- Competitive pressure: A credible alternative with better features, pricing, or experience pulls customers away.
- Involuntary churn: Expired cards and failed payments quietly remove customers who actually wanted to stay.
How to Reduce Churn Rate
Retention is rarely solved by one tactic. It is the cumulative effect of many small, deliberate improvements across the customer journey.
Strengthen Onboarding and Time-to-Value
Map the steps a new customer must take to reach a meaningful outcome, then remove friction at each one. Activation metrics — such as the percentage of new users who complete a key action within the first week — are reliable early predictors of long-term retention.
Invest in Customer Success
For higher-value accounts, proactive customer success teams identify at-risk users before they cancel, share best practices, and align the product with the customer’s evolving goals.
Segment At-Risk Users
Use behavioral signals — declining logins, reduced feature use, support ticket spikes — to flag accounts likely to churn, and intervene with targeted outreach, education, or offers.
Close Feedback Loops
Exit surveys, cancellation interviews, and ongoing NPS or CSAT tracking turn churn into a learning system. The goal is not just to measure dissatisfaction but to route it to the teams that can act on it.
Rationalize Pricing and Packaging
Plans should reflect how customers actually derive value. Periodic reviews of tiers, usage limits, and contract lengths can reduce both voluntary downgrades and involuntary churn from payment friction.
Benchmarks and Limitations to Keep in Mind
It is tempting to compare a company’s churn rate against industry benchmarks, but this should be done with care. A consumer mobile app, an SMB SaaS tool, and an enterprise software platform operate under very different dynamics, and a churn rate that looks alarming in one context can be normal in another. CFI and HBR both caution against drawing strong conclusions from cross-industry comparisons.
Cohort vs. Snapshot Measurement
Snapshot churn (one period, one number) can mask cohort-level reality. Cohort analysis — tracking groups of customers acquired in the same period over time — usually reveals more honest patterns and is the preferred lens for product and finance teams alike.
Contract Length Effects
Annual contracts mechanically suppress monthly churn relative to month-to-month plans, because customers only have meaningful opportunities to cancel at renewal. Comparing businesses on different contract structures without adjustment can be misleading.
Conclusion
Churn rate is deceptively simple to calculate and deeply consequential to manage. It quantifies how much of the customer base — or recurring revenue — slips away in a given period, and it sits at the intersection of product quality, customer experience, pricing, and competitive position. Whether you measure it as customer churn, gross revenue churn, or net revenue churn, the goal is the same: see clearly where value is being lost and act before the gap widens.
For marketers and operators, the lesson echoed by Bain, HBR, McKinsey, Investopedia, and CFI is consistent. Acquisition wins headlines, but retention compounds. A few percentage points of churn reduction, sustained over time, can do more for profitability and lifetime value than almost any single growth tactic — which is exactly why understanding churn rate is essential business literacy.
Official references
- Harvard Business Review (hbr.org) – Publishes peer-reviewed and editorially vetted articles on customer retention, churn, and customer lifetime value used widely in business education.
- Investopedia – Churn Rate Definition – Provides a standard, widely cited financial definition and formula for churn rate aimed at finance and business professionals.
- Corporate Finance Institute (CFI) (corporatefinanceinstitute.com) – Professional finance training organization with accredited reference material on customer churn, retention metrics, and SaaS finance KPIs.
- McKinsey & Company – Growth & Marketing Insights (mckinsey.com) – Authoritative consultancy research on customer retention, churn drivers, and revenue impact across industries.
- Bain & Company – Customer Loyalty Research (bain.com) – Originator of foundational research linking retention/churn reduction to profitability (Reichheld); primary source for churn economics.